Polaricon AB
POLARICON AB
Is a real-time query performance and diagnostics tool for the MySQL database server. It's core features:
-
Query, table and user performance
-
Graphical visualisation
-
Low overhead
-
User friendly
Query, table and user performance
Jet Profiler focuses on queries, tables and users. This gives you the information you need in order to quickly fix performance problems in your code, such as most frequent queries, most used tables or the busiest users.
Graphical visualisation
Data is collected, analyzed and displayed in real-time in diagrams, pie charts and tables. The graphical layout allows you to easily drill down and navigate your way through the vital data.
Low overhead
Most of the profiling work is done in the Jet Profiler application, not in the database server. Therefore, the performance hit is normally negligible, around 1%.
User friendly
It supports all MySQL versions. No database server changes are necessary. No agents or separate services are needed. Jet Profiler is a desktop application which runs on your computer. You start it, connect to a server, hit the record button and you can review the results in minutes. Jet Profiler runs on Windows, Mac and Linux.
Getting Started
1. Generate load
Once you have installed Jet Profiler for MySQL, you can start collecting profiling information from your target database server. In order for this to be interesting, you need to be able to generate load on the target server.
2. Record
First, make sure you have set the correct user. Click on the left-most toolbar button to edit connection settings and enter the root user (or any other user with enough rights).
Start recording by clicking the Record button. Depending on the load generated, it might take anything from a few seconds to a few minutes before you start seeing some results. We recommend recording at least 5 minutes.
3. Investigate
Once you’ve recorded some data, you can start looking into the data collected. Here’s a description of the various parts of the Jet Profiler main window. (Please note that all features may not be available in some versions.)
The line chart
By clicking on different presets, you will see different data in the line chart. Some of them:
- Threads - shows number of connections, number of running queries and number of slow queries are running.
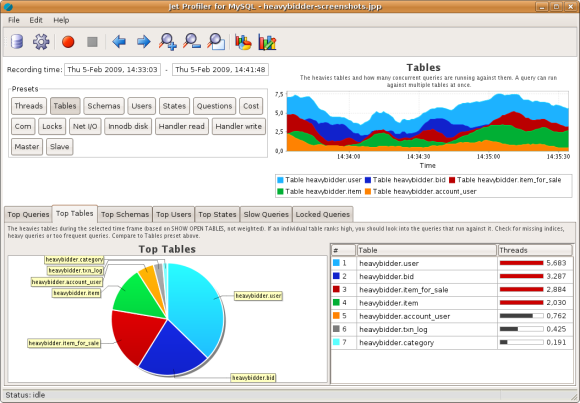
- Tables - shows the most frequently accessed database tables.
- Users - shows the most frequent users.
You can also click on the line chart to select and zoom in areas of interest.
The lower section
The tabs show different top lists of the recorded data. Some of them:
- Top Queries - shows the most frequent queries (the worst performing queries).
- Top Tables - shows the tables that were most frequently accessed.
- Top Users - shows the most frequent users.
Tips
If you can't seem to record anything, you can try polling more frequently. Adjust the polling interval in Recording settings (second toolbar button from left). Note that this comes with increased cost.
PRODUCTS

Jet Profiler for MySQL is real-time query performance and diagnostics tool for the MySQL database server. Its detailed query information, graphical interface and ease of use makes this a great tool for finding performance bottlenecks in your MySQL databases.
Jet Profiler for MySQL Profesional Version
Price:410.00 EURsecure.avangate.com/order/checkout.php
Jet Profiler for MySQL Enterprise Version
Price:699.00 EURsecure.avangate.com/order/checkout.php